Since the seminal work of Joslin, Priebsch, and Singleton (2014), a puzzling phenomenon has persisted in the macro-finance literature: the existence of “unspanned macro risks.” These are macroeconomic variables that have predictive power for future bond prices but are not spanned by the contemporaneous yield curve.
This presents a challenge to standard asset pricing theories. If a macroeconomic variable contains useful information for forecasting future returns, rational investors should immediately trade on it, causing the current yield curve to span that information. The existence of unspanned risks, therefore, implies a potential inefficiency in the bond market or a puzzle regarding how information is processed.
In our latest working paper co-authored with Kyu Ho Kang, “When Are Macro Risks Unspanned?: Evidence from a Regime-Switching Term Structure Model”, we provide a granular and theoretically grounded explanation for this phenomenon. We find that unspanned risks are not a permanent feature of the term structure but reflect episodic frictions in information transmission triggered by conflicting economic signals.
Using a regime-switching affine term structure model and Gaussian Process (GP) regression, we identified that real activity and inflation expectations become “unspanned” under very specific, distinct economic conditions.
Read More
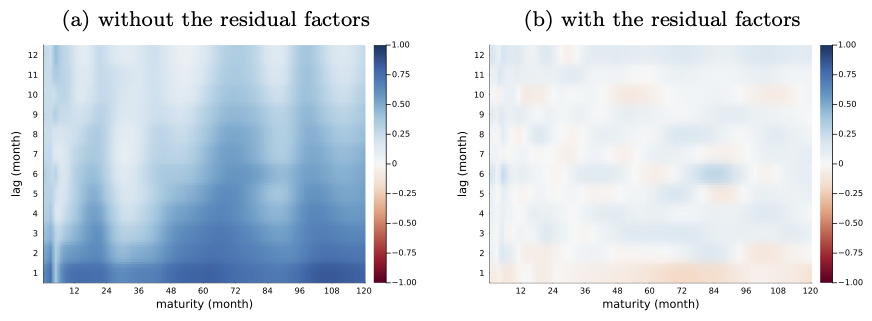
Figure 1. Autocorrelation in the residuals. The figure illustrates the autocorrelation of the residuals from the regression of bond yields. Panel (a) shows the results when using the first three principal components of bond yields as regressors, while panel (b) presents the results when both the principal components and the residual factors are used as regressors.
One concern that arises when analyzing bond market models is the strong autocorrelation hidden in the pricing errors of the estimated models. This suggests the presence of systematic movements that traditional bond market models fail to capture. The most rigorous solution is to refine theoretical models to whiten these pricing errors. However, given that traditional models explain nearly 100% of the cross-sectional variation, the practical significance of the remaining autocorrelation in residuals may be negligible. If that is the case, the necessity of improving theoretical models diminishes. In my new study, I examine whether the residual autocorrelation contains additional predictive power and whether leveraging it can enhance bond investment returns.
Read More
Recently, I developed a Julia package, TermStructureModels.jl, designed to simplify the estimation of the no-arbitrage term structure model of bond yields. This package was born from my desire to enable users to estimate and apply term structure models in practice without needing a deep understanding of the model. This is achieved by the package automatically configuring the model settings based on the data. Users will find that they can estimate the term structure model without having to worry about the settings.
Read More

Figure 1. Recent Uprising of the Long End of the Yield Curve
The time required to traverse the peak of the Fed rate cycle has lengthened(higher-for-longer), owing to the adaptation of the U.S. economy to elevated yields and its subsequent robust growth. Concurrently, the long end of the yield curve continues its upward trajectory (see Figure 1).
I do not attribute this phenomenon to policy channels, particularly since long-term yields have surged more dramatically than their medium-term counterparts. This could be due to expectations of a decline (or increase) in the long-run value of money (or long-run neutral inflation). Alternatively, investors may withdraw their funds from the bond market and await an opportune moment to invest in riskier assets as the Fed’s rate-hiking cycle is expected to conclude.
The increase in long-term yields benefits the Fed, as it aids them in achieving their inflation targets. However, if these yields escalate excessively, it can compromise financial market stability. In this case, the Fed may be compelled to prematurely lower its target rate.
Read More
Discrepancies between the representative and current yield curves highlight the maturities most affected by FOMC decisions. Minimal discrepancies imply that the FOMC might struggle to adjust the corresponding yield rate as desired.
In the figure, following the Fed rate hike initiated in March 2022, pronounced discrepancies become apparent around the medium segment of the yield curve (within a two-year scope). These discrepancies were well transmitted to the long-term maturities throughout 2022. However, from 2023, these discrepancies notably reduced at the long end of the yield curve.
Read More
After Joslin, Priebsch, and Singleton (2014), many studies found some price-relevant macro information that is hard to be extracted from the U.S. yield curve. It is a little weird because if there is such useful information, investors immediately use the information to make money, so the bond price also immediately moves to reflect that information. Therefore, all information relevant to the bond market should be reflected in the yield curve (and bond prices). In other words, the existence of information that is not spanned by the yield curve (we call it “unspanned” information or risk) is a puzzle in bond pricing literature.
The easiest way to understand the puzzle is by arguing the inefficiency of the bond market (or investors). Yeah, the bond market may be inefficient and investors are not always rational. From this perspective, Cieslak (2018)’s finding is notable. He argues that investors’ systematic forecasting errors for the monetary policy create unspanned information that has ex-post predictability. Therefore, according to this paper, investors cannot utilize this unspanned information.
On the other hand, if you do not want to abandon FIRE (full-information rational expectation) assumption, there is also an existing way to explain it. Some people (Duffee, 2011; Cieslak and Povala, 2015; Bauer and Rudebusch, 2017) argue that all information is in the yield curve, but measurement errors prevent us from extracting some information, so it seems as if the information does not exist in the yield curve.
In this post, I want to raise another explanation briefly using the working paper that was jointly written by Kyu Ho Kang and me. The main topic of our paper is the time-varying influence of unspanned macro risks on future yields.
Read More
Many papers, including Ciccarelli and Mojon (2010), have found that global inflation drives domestic inflation internationally. On the other hand, Diebold, Li, and Yue (2008) define and estimate the global yield curve, which represents the comovement of domestic bond yields. In fact, verifying the existence of these global factors is straightforward. Lee and Kang (2023) conducted a PCA analysis on the inflation and interest rates of 30 OECD countries. They found that 77.9%, 82.5%, and 53.3% of the total variations in long-term yields, short-term yields, and inflation are explained by the corresponding first principal components, respectively.
What caught our attention is that existing literature has not explored the relationship between global inflation and the global yield curve—a relationship especially evident when considering the Fisher equation.
$i_{t} = r_{t} + \pi_{t}$, where $i_{t}$ and $r_{t}$ are nominal and real interest rates at time $t$ and $\pi_t$ is inflation at time $t$.
How can the comovement of $\pi_{t}$ be irrelevant to the comovement of $i_{t}$? We believe global inflation should be examined alongside the global yield curve or vice versa. Our working paper, mentioned earlier, employs a high-dimensional empirical model that incorporates both global comovements and then estimates it to dissect the essence of these two comovement phenomena.
Read More
Read More

